Images: Satellites keep eye on hurricanes

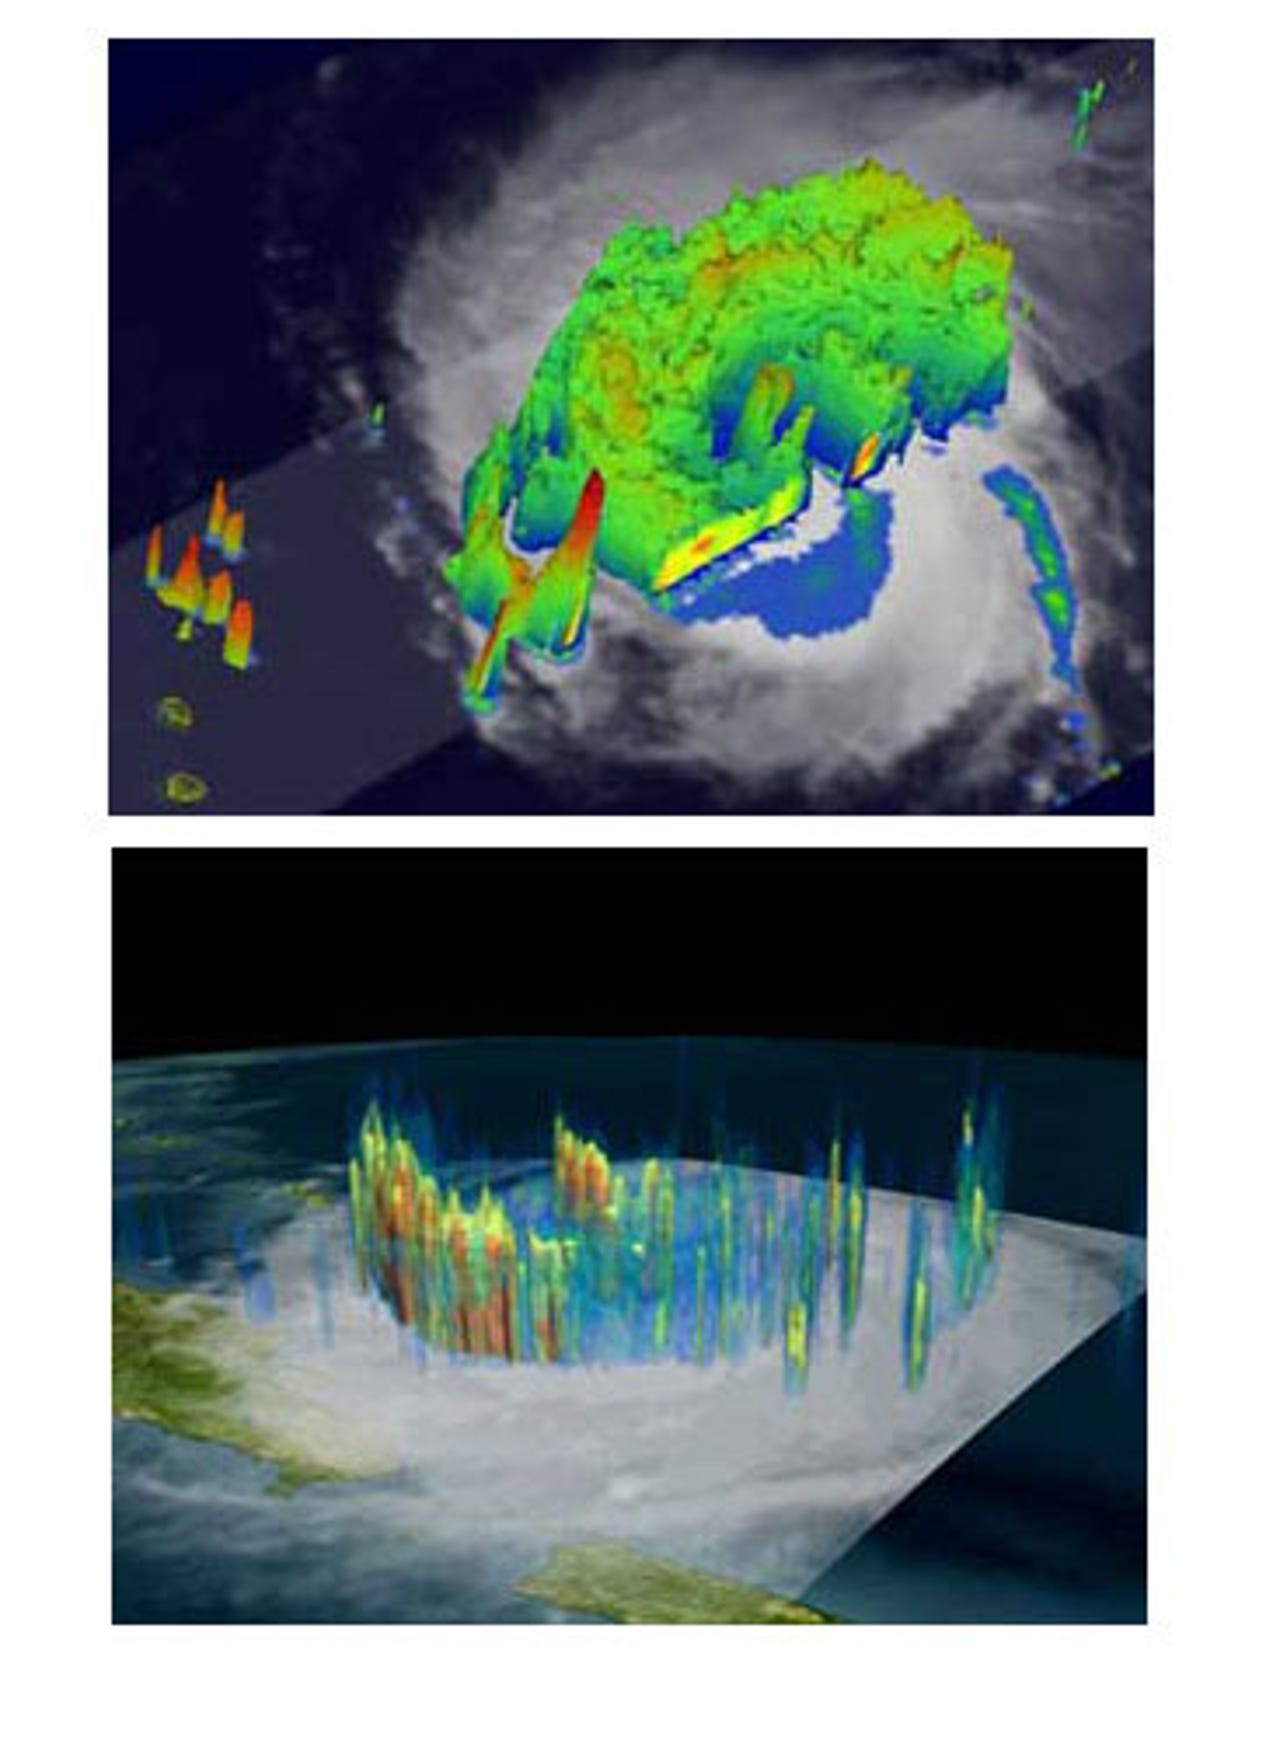
Towers of heat
The space agency's Tropical Rainfall Measuring Mission (TRMM) satellite can show hurricanes in color and three dimensions. In these two images, red indicates regions of the most significant rainfall. The spires, called "hot towers," suggest a powerful heat engine inside the storm, which signals its growth potential.
Water temperature
The key factor to hurricane season is the water temperature. Hurricanes cannot exist over water cooler than 82 degrees Fahrenheit. This map shows temperatures (in orange and yellow) from September 2004 in areas that proved to be a feeding ground for deadly storms including Frances and Ivan.
Hurricanes in 3D
Here, Hurricane Frances is defined by a tightly wound ball of high winds over Florida; Ivan is still a tropical depression forming in the eastern Atlantic. The colors represent total precipitable water (blue is low, red is high).
Tracking intensity
This map shows the intensity of Hurricane Ivan throughout its meandering path. Purple is the weakest classification (tropical depression), and red is the fiercest (class five).
TRMM Hurricane Ivan rainfall structure
Another look at Hurricane Ivan, from Sept. 16, 2004. Blue represents areas with at least a quarter-inch of rain per hour, green shows at least a half-inch of rain per hour, and yellow, at least one inch of rain per hour.